

Razgrad
Razgrad has 27,517 residents (2025). Average gross wage in the district EUR 1,136 (Q3 2026), registered unemployment in the municipality 4.3% (2025).
Data updated 13.11.2026 · Sources and methodology
Work and economy
What is the average salary in Razgrad?
The average gross monthly wage in Razgrad district is EUR 1,136 (Q3 2026, NSI, preliminary data). The national average is EUR 1,438.
Source: NSI, average gross monthly wage by district, Q3 2026 (preliminary data); NSI, average gross monthly wage, national, Q3 2026 (preliminary data); change, rank and gap: BWY calculation
Gross wage by quarter
EUR a month, district average, Q4 2024 – Q3 2026
The data in a table
| Quarter | Razgrad district | Bulgaria | Change on the quarter |
|---|---|---|---|
| Q3 2026 | EUR 1,136 | EUR 1,438 | +2.3% |
| Q2 2026 | EUR 1,110 | EUR 1,444 | +2.1% |
| Q1 2026 | EUR 1,087 | EUR 1,407 | +0.2% |
| Q4 2025 | EUR 1,085 | EUR 1,369 | +6.8% |
| Q3 2025 | EUR 1,016 | EUR 1,303 | −2.3% |
| Q2 2025 | EUR 1,040 | EUR 1,315 | +8.3% |
| Q1 2025 | EUR 960 | EUR 1,249 | −0.1% |
| Q4 2024 | EUR 961 | EUR 1,234 |
Source: NSI, average gross monthly wage by district, Q4 2024 – Q3 2026 (preliminary data); NSI, average gross monthly wage, national, Q4 2024 – Q3 2026 (preliminary data)
Gross wage by district
28 districts, Q3 2026
For Lovech: EUR 1,132 in Q3 2026. Here the wage is about the same.
Source: NSI, average gross monthly wage by district, Q3 2026 (preliminary data); gap to the compared city: BWY calculation
Registered unemployment by municipality
27 districts, 2025
For Razgrad: 4.3% in the municipality and 9.9% in the district.
For Lovech: 6.2% in the municipality and 8.3% in the district.
Source: Employment Agency, average annual registered unemployment rate, 2025
Jobs in Razgrad
2 job posts in Razgrad district: 2 in Razgrad. 1 of them were published in the last 30 days.
By field
The 3 most common of 3 fields; one post can be in more than one
Work type
Number of job posts

Служители в отдели на пълно работно време, гр. Разград

Tърговски консултант в магазин, гр. Разград
Employers in Razgrad


Cost of living
How much do water, electricity and heating cost in Razgrad?
Household prices in Razgrad, incl. VAT: electricity EUR 0.1552/kWh, water and sewerage EUR 3.24/m³, district heating EUR 88.97/MWh, natural gas with transmission EUR 82.68/MWh.
For Lovech: 2,458 degree days. The heating season here is milder.
Source: KEVR decisions and the gas suppliers' price notices; prices with VAT and gas with transmission: BWY calculation; NSI, average prices of non-food goods bought by households, 2025; Eurostat, nrg_chddr2_a, accessed 13.11.2026
Monthly costs by household in Razgrad
Food at home, electricity without heating and water, EUR a month
At the official prices stored for each city, incl. VAT; municipal kindergarten 0 EUR with a place. Rows rounded to the euro, totals to EUR 10. Rent, heating, transport, telecom and eating out are not included: add them in the calculator.
How prices move
Consumer prices, change over 12 months, national, 10.2026 (preliminary data)
Official price statistics exist only for the country as a whole; the changes apply to Razgrad as to every other city.
Source: Eurostat, prc_hicp_minr, accessed 13.11.2026
Properties in Razgrad
3 listings of the partner agencies Home2U and INclusive in Razgrad district: 3 for sale and 0 to rent.
By property type
The 2 most common of 2 types
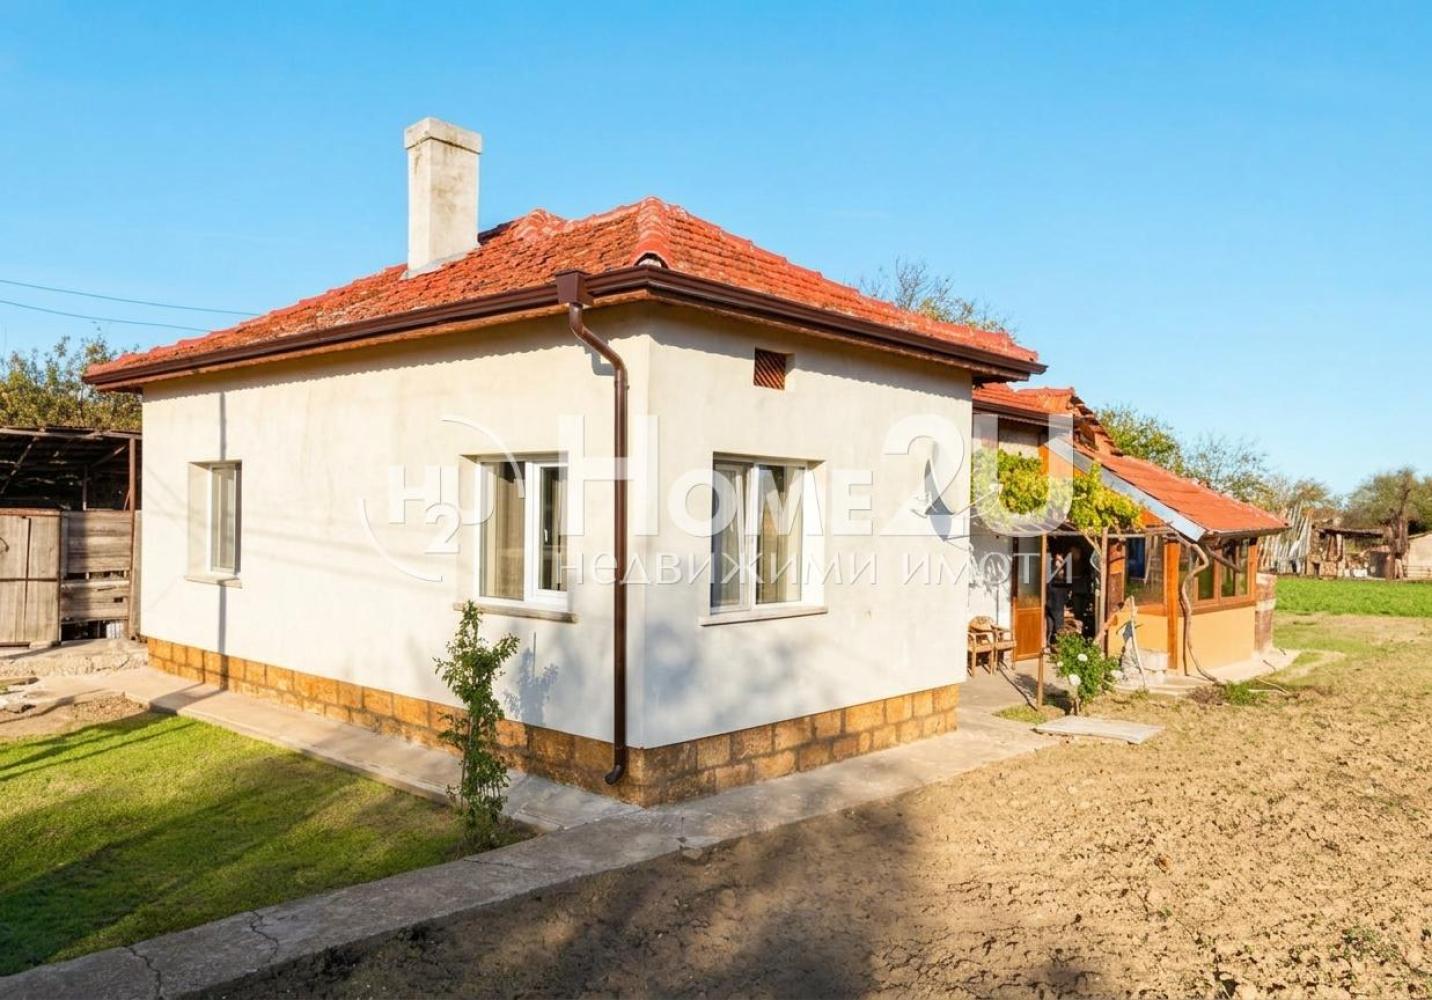

Къща
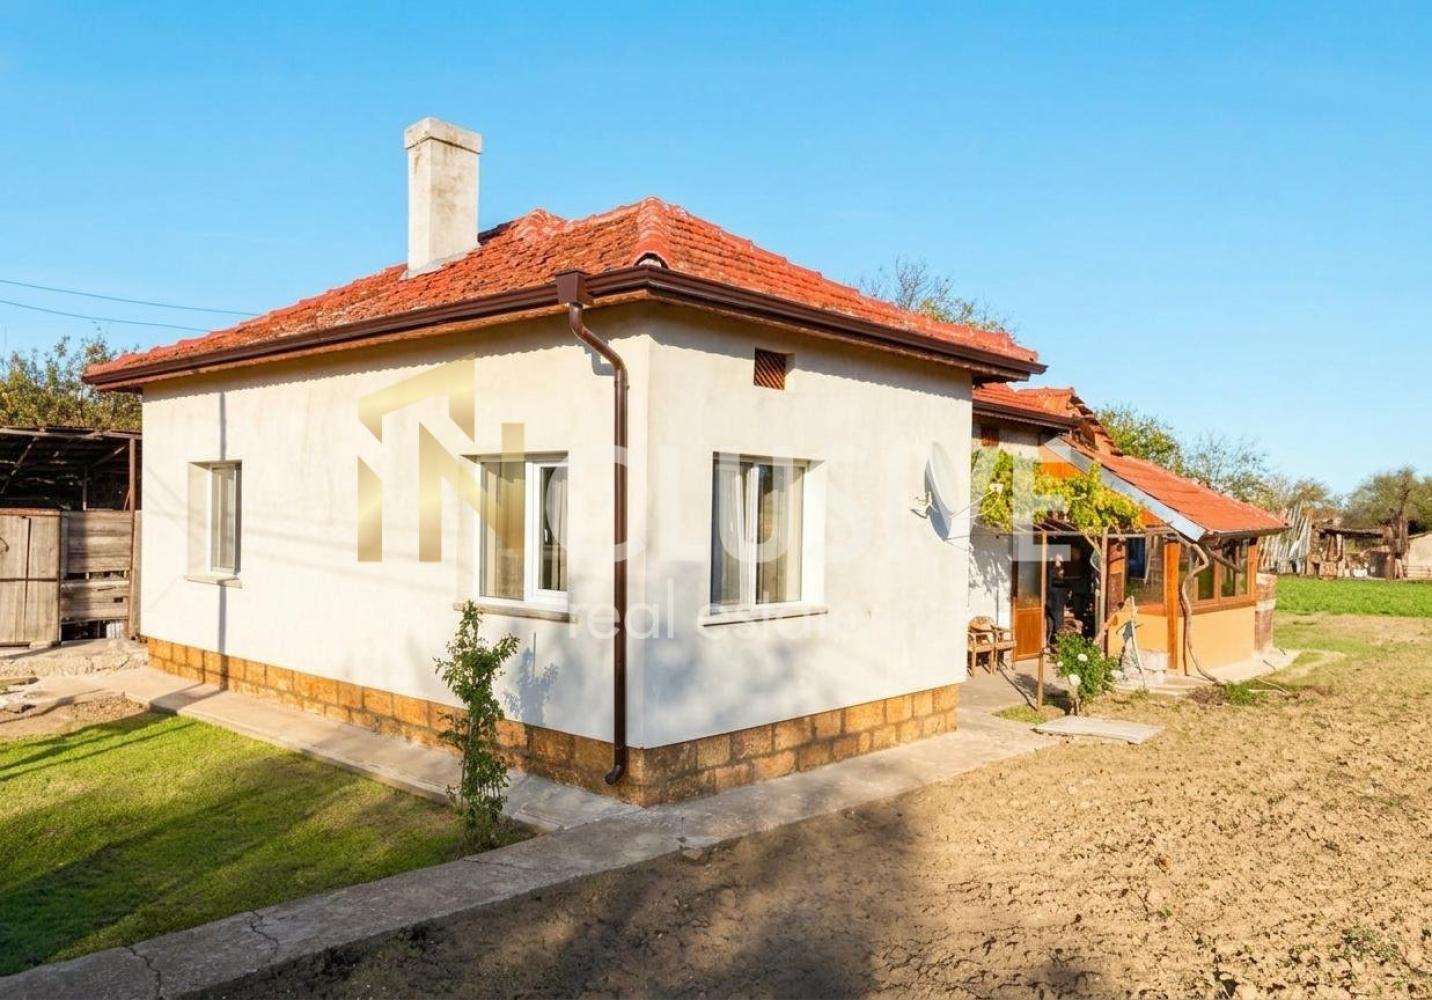

Къща
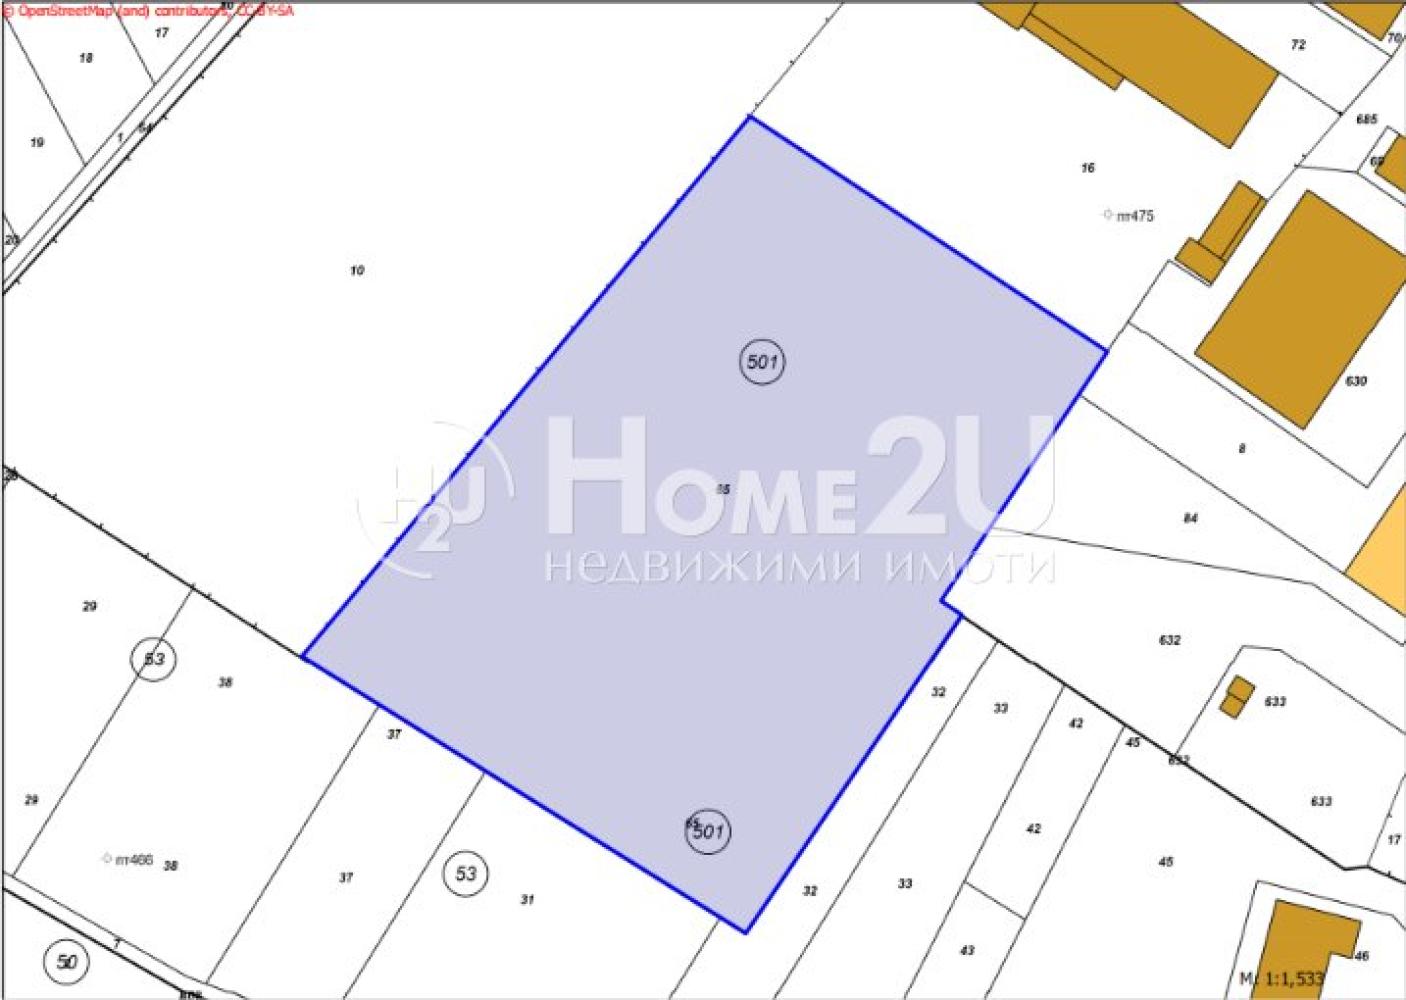
Парцел
Calculator
Education
How does a child get a place in a municipal kindergarten in Razgrad?
- How to apply
- Online, in the municipal system: dgrazgrad.uslugi.io
- Campaign
- online only for the first group in the town, three rankings May-June (2026: first round 11-27 May); other groups on paper
- Address
- points for a permanent or current address in the kindergarten's area
- Rules
- Municipal ordinance
Source: the municipality's ordinance and admission system, checked 12.10.2026; compensation: Ministry of Education and Science. Rules change every year: check the dates with the municipality before you apply.
Healthcare
How many hospitals and physicians does Razgrad district have?
Razgrad district has 3 hospitals with 465 beds and 288 physicians, 40 of them general practitioners (31.12.2025, NSI). A self-insured person pays EUR 24.81 a month for health insurance (from 08.2026).
Source: NSI, health establishments and beds by district as of 31 December, 2025; NSI, physicians by specialty and district as of 31 December, 2025; NRA, Road Infrastructure Agency, Ministry of Education, national fees and amounts set by law, 13.11.2026
Transport and infrastructure
Nearest airports with scheduled flights
Source: Eurostat, avia_paoa, accessed 13.11.2026; distances in a straight line from the town centre: BWY calculation
Fuel prices
Including taxes, national average
Source: European Commission, Weekly Oil Bulletin, 09.11.2026
Culture and entertainment
How many museums and cinema-goers does Razgrad district have?
The museums of Razgrad district number 3, with 30,239 visits in 2025. Its cinemas had 10,624 admissions in 2024.
Source: NSI, museums by district, 2025; NSI, cinema screenings and admissions by district, 2024
Tourism
How many visitors stay in Razgrad district, and when?
Visitors spent 51,670 nights in the tourist accommodation of Razgrad district in 2025, 18.6% of them visitors from abroad (Eurostat). The strongest month of the last twelve was August 2026 with 5,361 nights, the quietest February 2026 with 2,505 (NSI).
For Lovech: 2,568. Fewer visitors stay here for the size of the district.
Source: Eurostat, tour_occ_nin3, accessed 13.11.2026
Where the visitors come from
Nights in Razgrad district, 2025
Source: Eurostat, tour_occ_nin3, accessed 13.11.2026
Nights by month
Razgrad district, October 2025 – September 2026
The strongest month: August 2026
The data in a table
| Month | Establishments open | Beds | Nights | Guests | Revenue from nights, EUR |
|---|---|---|---|---|---|
| September 2026 | 19 | 697 | 3,683 | 1,770 | 148,325 |
| August 2026 | 20 | 740 | 5,361 | 2,405 | 197,339 |
| July 2026 | 18 | 681 | 5,241 | 2,612 | 187,243 |
| June 2026 | 20 | 742 | 4,031 | 2,193 | 152,963 |
| May 2026 | 19 | 726 | 4,598 | 2,458 | 175,095 |
| April 2026 | 20 | 711 | 3,856 | 2,004 | 153,342 |
| March 2026 | 19 | 629 | 3,448 | 1,951 | 147,555 |
| February 2026 | 17 | 590 | 2,505 | 1,329 | 116,552 |
| January 2026 | 19 | 688 | 2,913 | 1,223 | 113,167 |
| December 2025 | 20 | 726 | 3,408 | 1,548 | 129,273 |
| November 2025 | 19 | 712 | 4,489 | 1,967 | 147,502 |
| October 2025 | 20 | 717 | 5,357 | 2,072 | 166,758 |
Source: NSI, activity of the accommodation establishments by district, 10.2025 – 09.2026
Business and investment opportunities
How large is the economy of Razgrad district?
GDP per inhabitant in Razgrad district is EUR 9,100 (2024, Eurostat). The national figure is EUR 16,300. 4,075 enterprises were active in 2024, 425 of them newly founded.
Source: Eurostat, nama_10r_3gdp, accessed 13.11.2026; Eurostat, bd_size_r, accessed 13.11.2026
Gross value added by sector
Razgrad district, 2024, at current prices; 793 million EUR in all
Source: Eurostat, nama_10r_3gva, accessed 13.11.2026
Razgrad compared with the others
Pick another city above or on the map to change the comparison.
Sources: NSI, the Employment Agency, KEVR, the gas suppliers' price notices, Eurostat, the municipalities and the listings of Home2U and INclusive, as in the sections above.
Other district cities
Pick a district on the map to compare it with Razgrad.